Latent Lab is a project I worked on at the MIT Media Lab in the Viral Communications Group with Kevin Dunnell and Andrew Stoddard. The project was published at the International Conference on Computational Creativity (ICCC) 2023.
Latent Lab is a visually appealing tool to explore a knowledge base, all powered by an LLM.
What do I mean by that?
We can consider the example of all the projects at the MIT Media Lab. There are thousands of projects, across a wide range of topics. Currently, these projects are organized by manual human tagging or naive keyword search. There's a huge opportunity to leverage the power of machine learning to organize and explore this information.
Interface Design
Latent Lab is made up of 4 major components: Map Visualization, Generation Workbench, Search and Summarization, and Timeline Slider

01. Map Visualization
In the map visualization, each dot represents a piece of information from the knowledge base. In the case of the MIT Media Lab, each dot represents a project.
The projects are organized by their embedding in the LLM's latent space which are dimensionality reduced into 2 dimensions. What does this mean?
Projects closer together in the map are interpreted as being more similar to each other by the LLM.
Key Features
Dots and Cluster Labels: The dots represent individual research projects. Cluster labels are generated by an LLM to indicate themes.
Color Coding: The different colors of the dots are linked to different research groups. This can also be tailored to show other attributes.
Contour Lines: Borrowed from the idea of elevation lines on physical maps, these lines show the concentration of research in different areas. When paired with the timeline, they illustrate the evolution of research focus over time.
Zooming & Panning: You can zoom in to view detailed project information and labels. As you zoom in or out, the information shown adjusts accordingly.
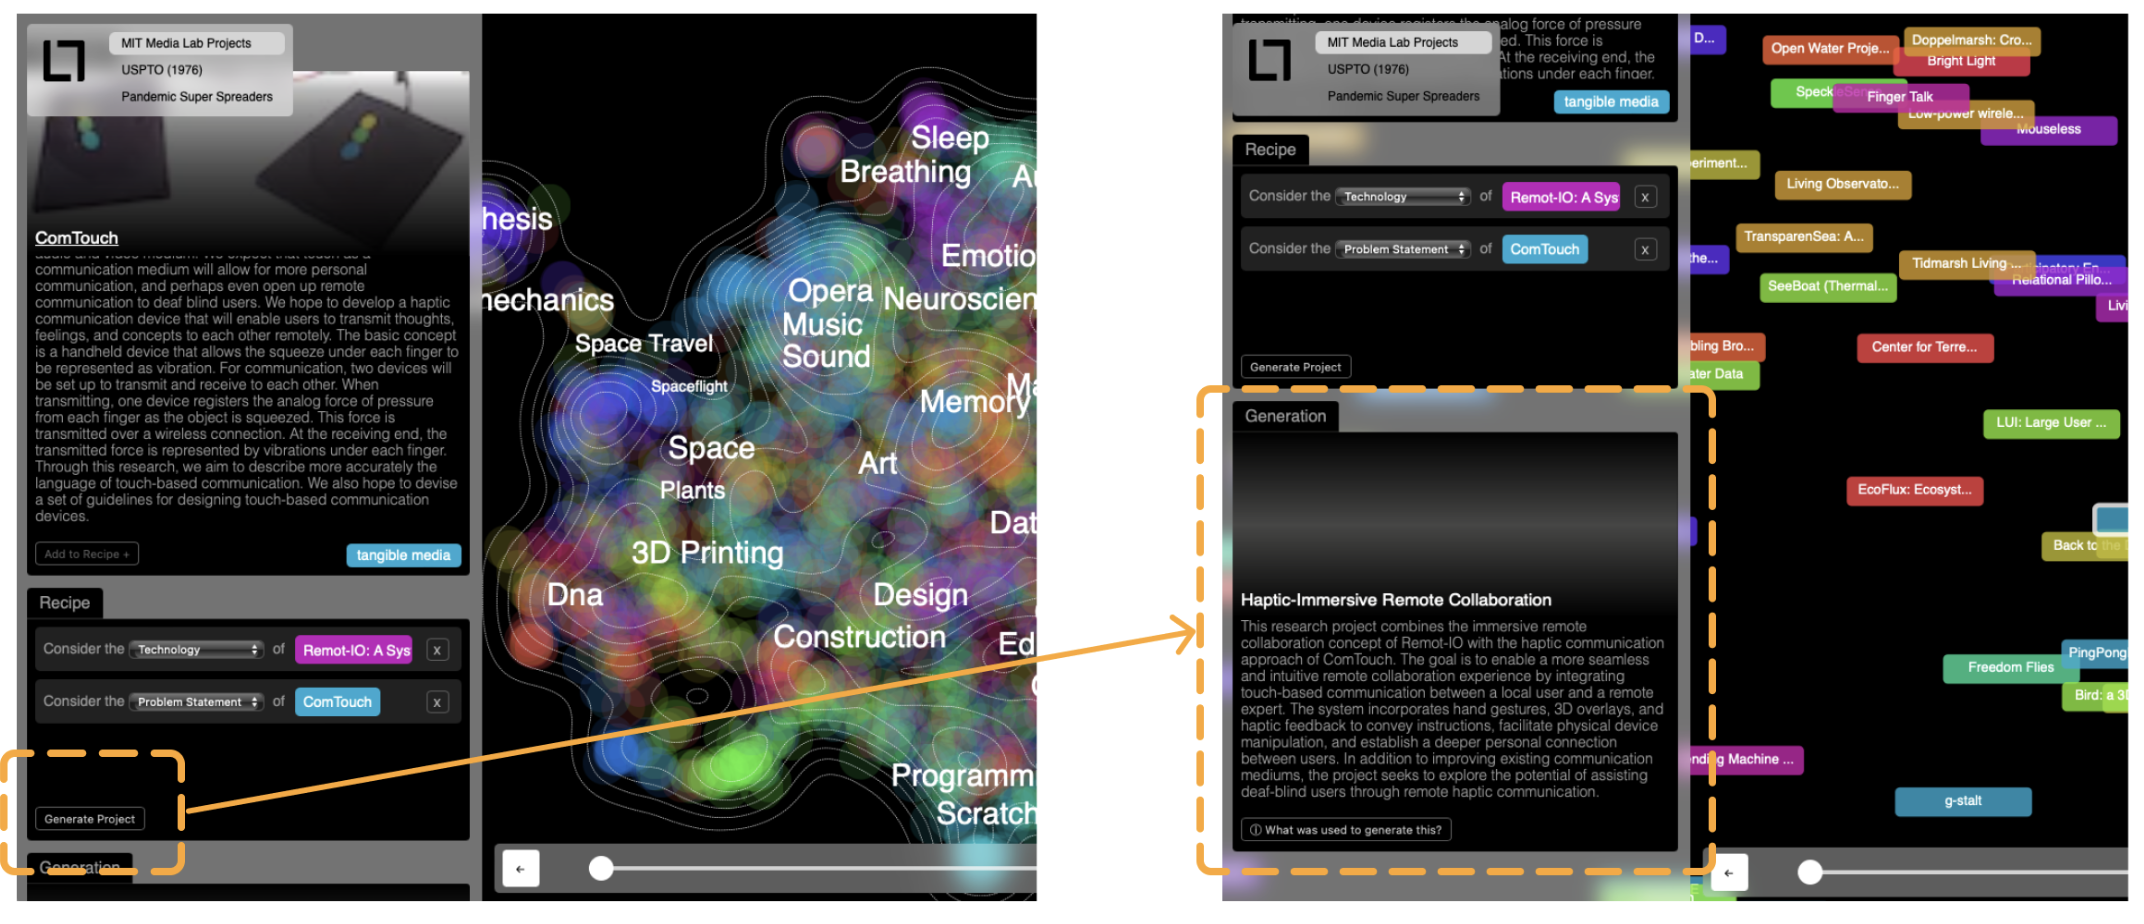
02. Generation Workbench
Think of the generation workbench as a digital mixing station where you can combine different project elements to create a new research idea.
Key Features:
Creating a Recipe: You can pick and combine different parts of projects—like the community focus, problem being tackled, or the technology being used.
Synthesizing Ideas: Once you've chosen the elements, hitting “generate” will use the power of GPT-4 to create a new project title and description for you.
Transparency: Curious about how your new project idea was formed? There's a handy "What was used to generate this?" button for insight.
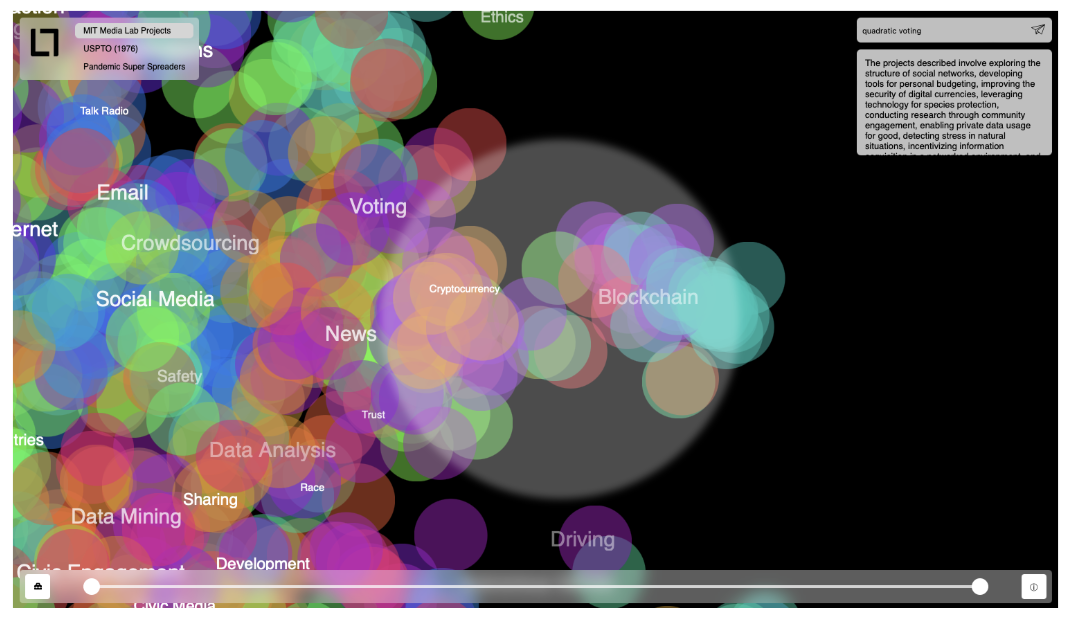
03. Search & Summarization
A search function, but supercharged. Instead of just looking for exact keywords, the "search" finds the closest projects to your query in the LLM's latent space. This means that you can search for a concept and find projects that are related to it, even if they don't contain the exact word.
Key Features:
Contextual Search: When you type in a search term, it doesn't just look for exact matches. It understands the deeper meaning behind your words.
Visual Feedback: Your search results are highlighted on the map, guiding you directly to relevant projects.
Quick Summaries: Right below the search bar, you get AI-generated overviews of projects in the section of the map you’re currently viewing.
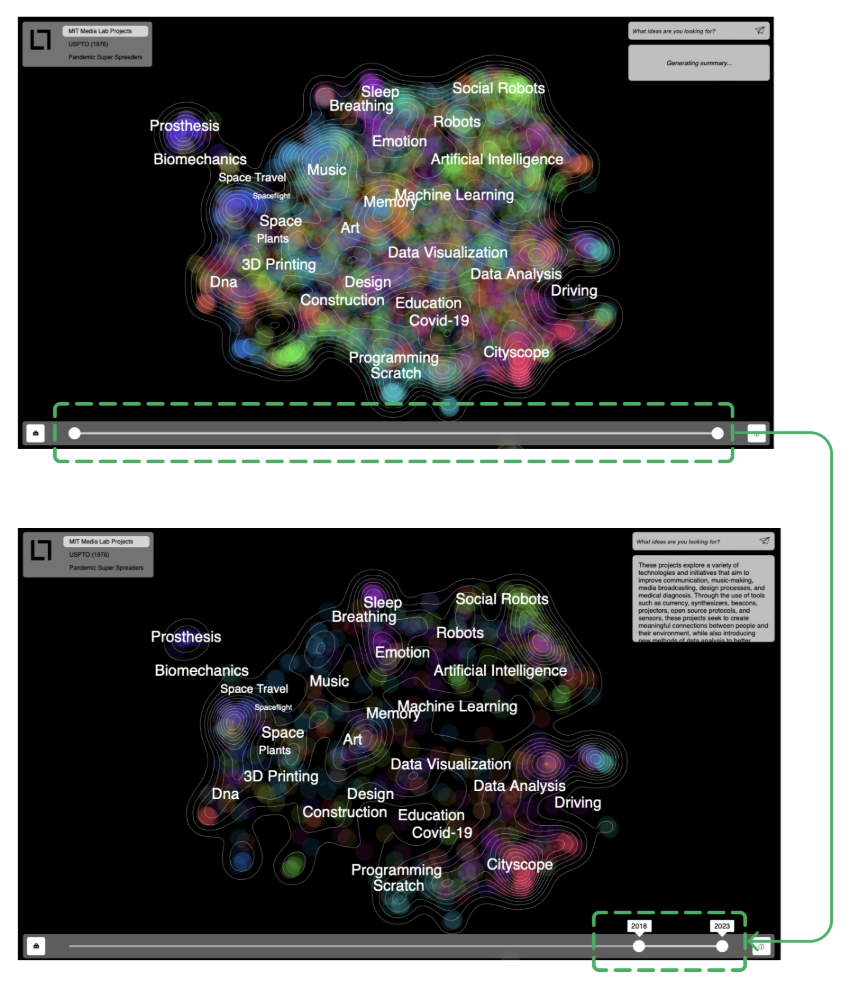
04. Timeline Slider
A time-travel slider to explore how research themes evolve over time. This is especially useful when zoomed in to a specific part of the map to see how research has blossomed.
Key Features:
Date Sliders: Choose your desired start and end dates to view projects within that time range.
Focused Exploration: This feature is especially useful when zoomed in to a specific part of the map, allowing you to see how specific research themes have evolved over time.
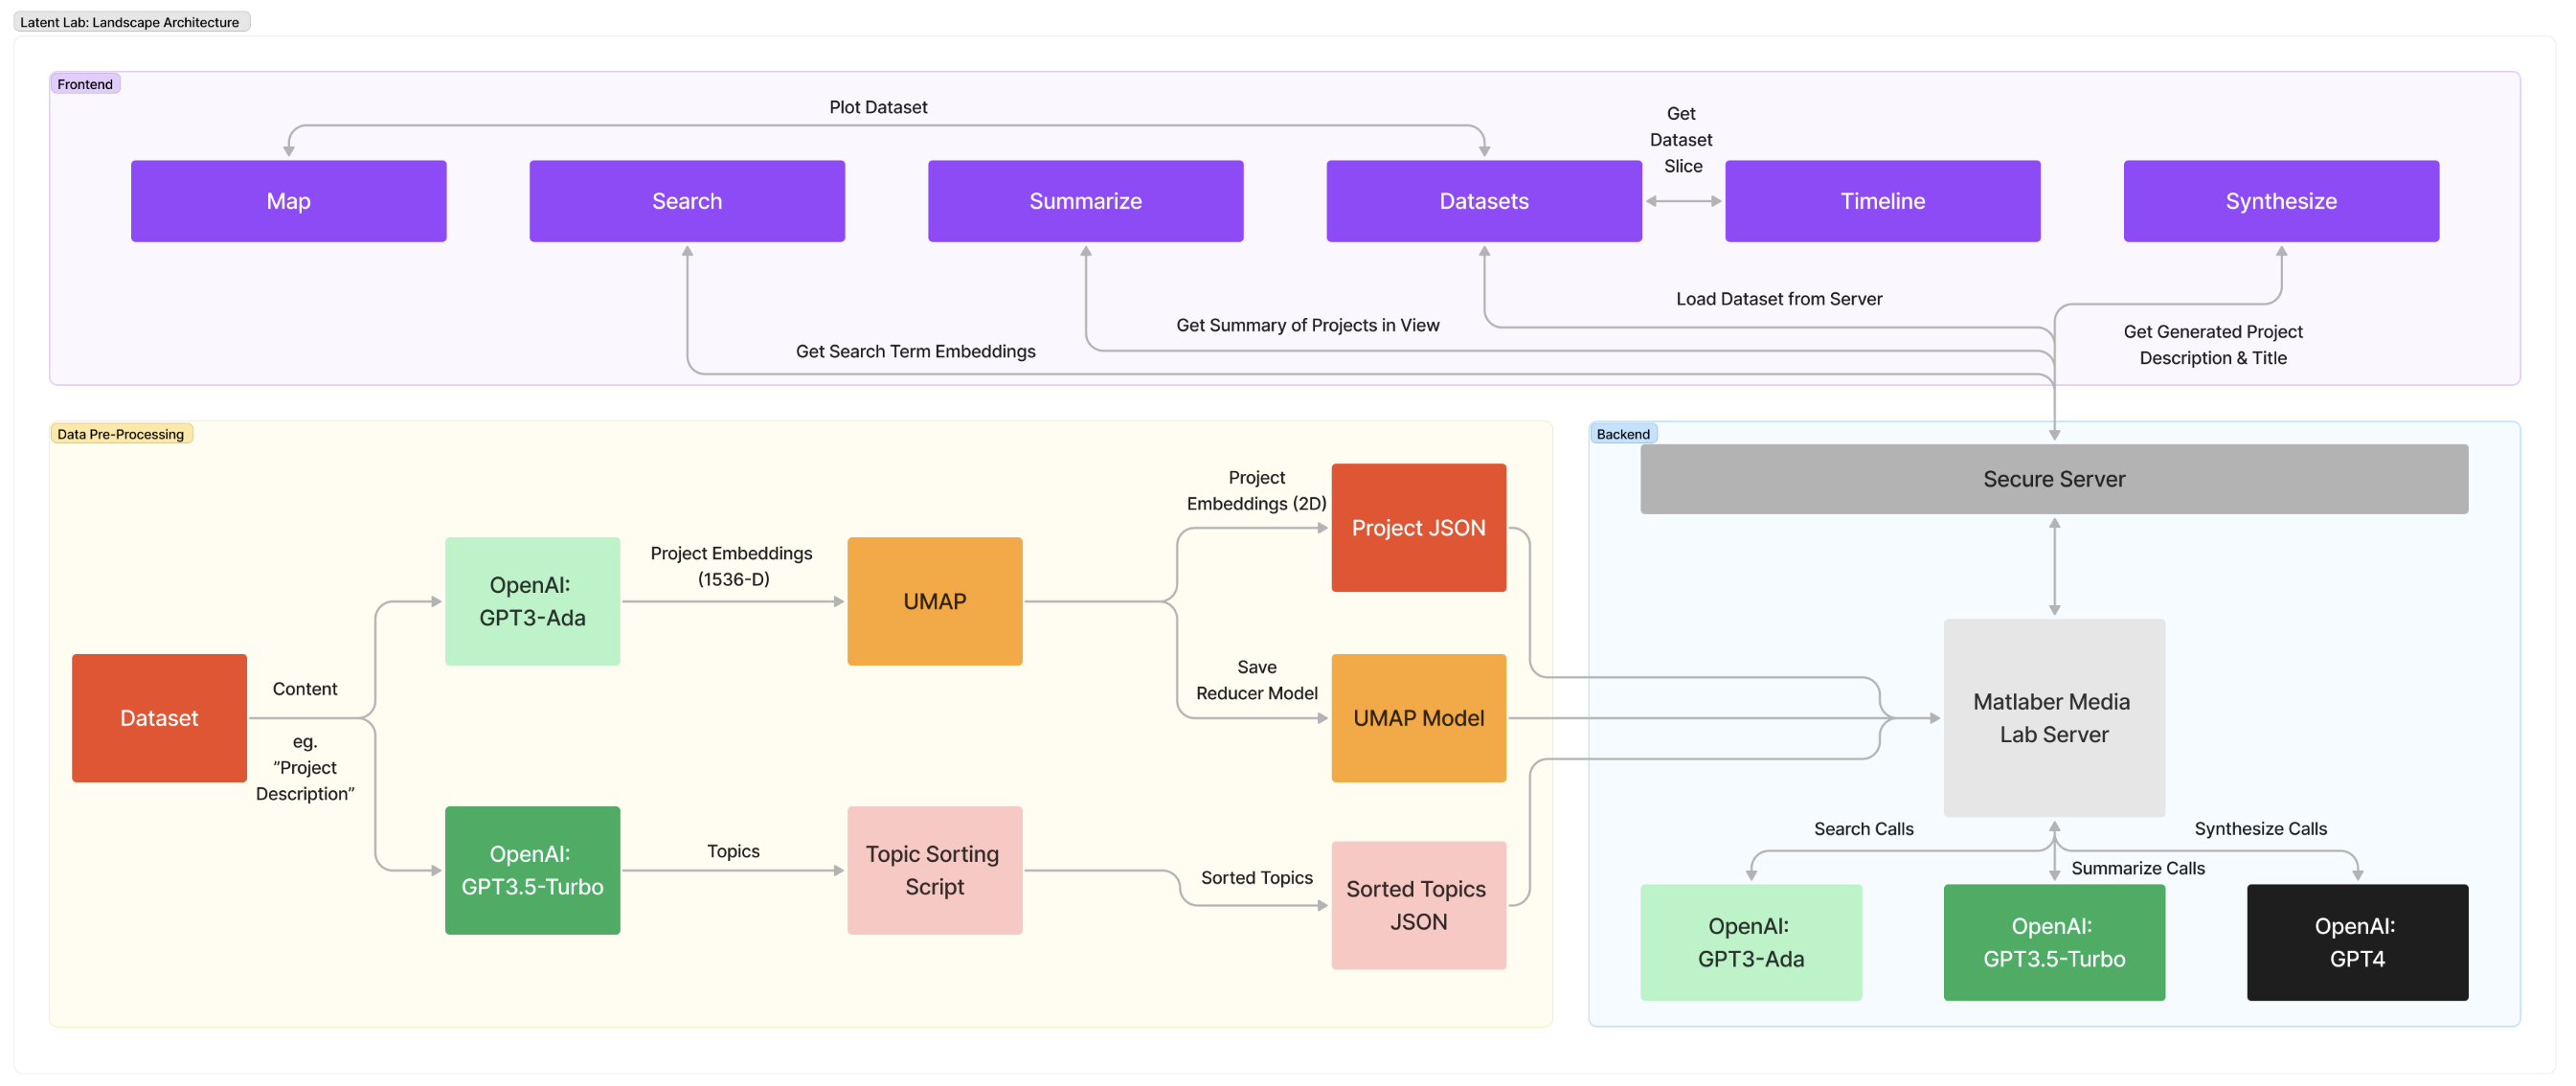
System Overview
The backend is 2 parts: a Flask data processing server and a Next.js web app.
The Flask server handles the data-preprocessing. It takes in a Google Sheet of data, runs it through the LLM, and outputs the processed data as a JSON file used to render the frontend components. We use OpenAI GPT models for our LLM and accessed them through a REST API. This means that a user could easily swap out the model for a different one in the future.
The Next.js web app is deployed on Vercel. It communicates with the Flask server to get the processed data for the frontend components. It also makes calls to the OpenAI API for functions like generating project descriptions and map summaries.
The frontend is a React app that uses WebGL-optimized D3.js for the map visualization.
More information about the system architecture can be found in the published paper.
Our code is not open source yet. However, reach out with any questions. I'd be happy to chat about more tech specs!
Latent Lab Applications
The beauty of LLMs is that they are adaptable to any domain. While Latent Lab initially focused on MIT Media Lab projects, its potential isn't limited to this. It has been successfully employed in organizing diverse data sets, such as Tweets, patents, foreign exchange risk articles, and more.
If you're interested in exploring your own dataset using Latent Lab, you can upload your data as a Google sheet and try it out here. For further collaboration or ideas, please reach out to me at hello@trudy.computer.