MIT Music Map was my final group project for CMS.405 (Visual Design). I worked with Hanu Park and Rachel Chae. We designed and implemented an interactive data visualization of where MIT students listen to songs on campus.
Project Overview
For this project, we were tasked with creating an interactive data visualization. We wanted to explore the question:
How does the location affect the type of song someone listens to?
We sent out a survey that over 100 students responded to. The survey asked students to list a recent song they listened to in one of the following locations:
Z Center (athletic center)
Infinite Corridor (main hallway)
Hayden Library (main library)
Visualization Auras
My group was inspired by the "Kiki and Bouba" experiment, which showed that people associate certain words with certain shapes. We wanted to see if we could visualize the type of songs listened to in an area using "kiki and bouba"-esque auras.
Data
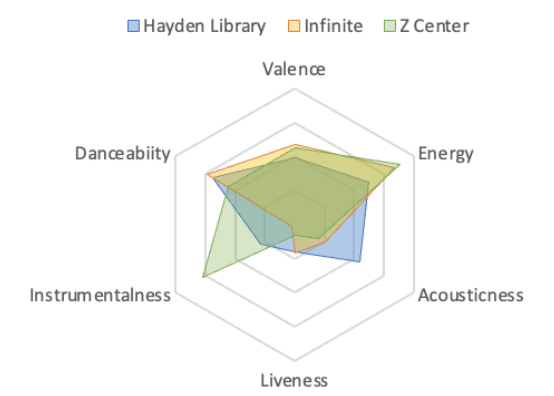
Below is the data about the songs listened to at each location. We used the Spotify API to get the song data like mood, energy, and danceability.
Key
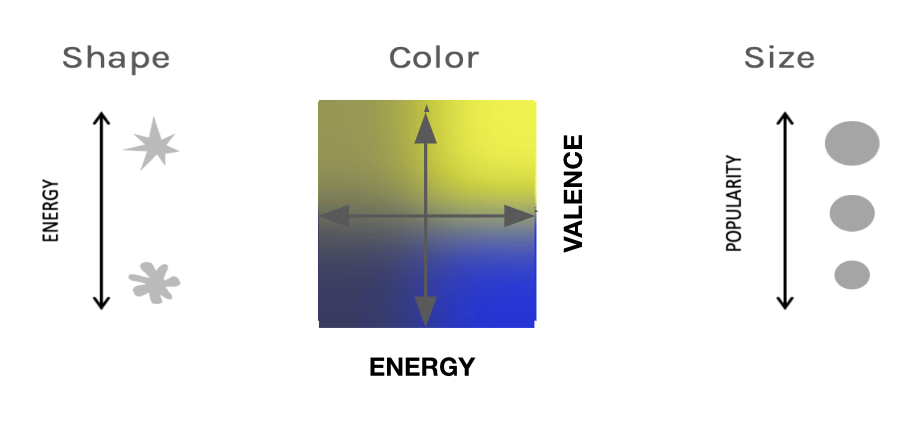
Once we had the semantic data about the songs at each location, we designed a key for a visual system that would represent the data.
Final Auras
Using the key, these are the final visualizations for each location.
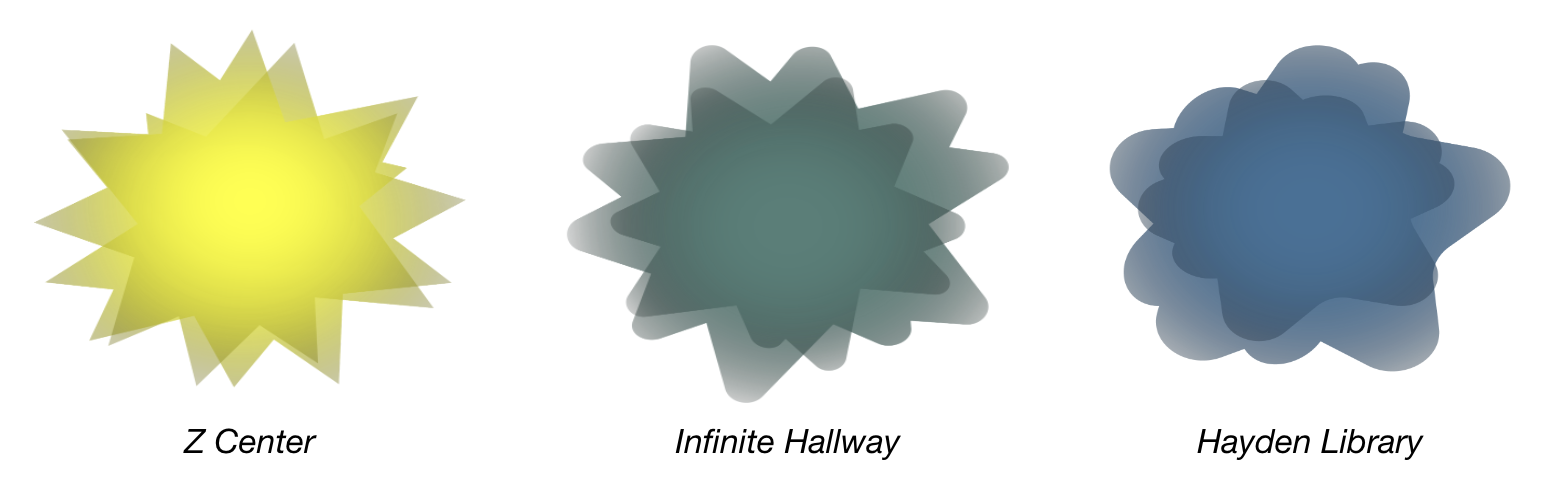
The Z Center (athletic center) aura reflects higher energy, happier songs. The Infinite Corridor (main hallway) aura reflects more neutral songs. The Hayden Library (main library) aura reflects lower energy, sadder songs.
Interaction
The auras provided a macro view of the data, but we wanted to provide a way for users to explore the data on a more granular level.
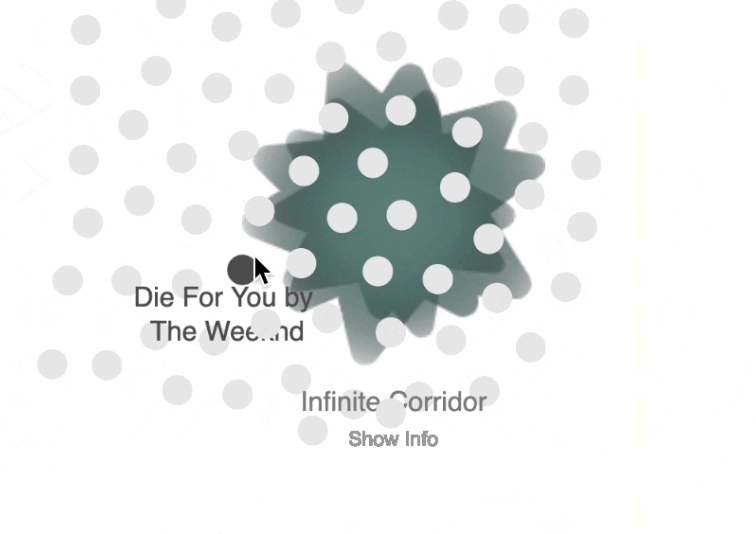
We decided to use a flocking algorithm where each song is represented by a gray circle. The songs are attracted to the location they were listened to at, creating a "flock" of songs at each location.
Users can hover over a song to see the song's name + artist. Clicking on a song reveals a popup with more information.
Flocking
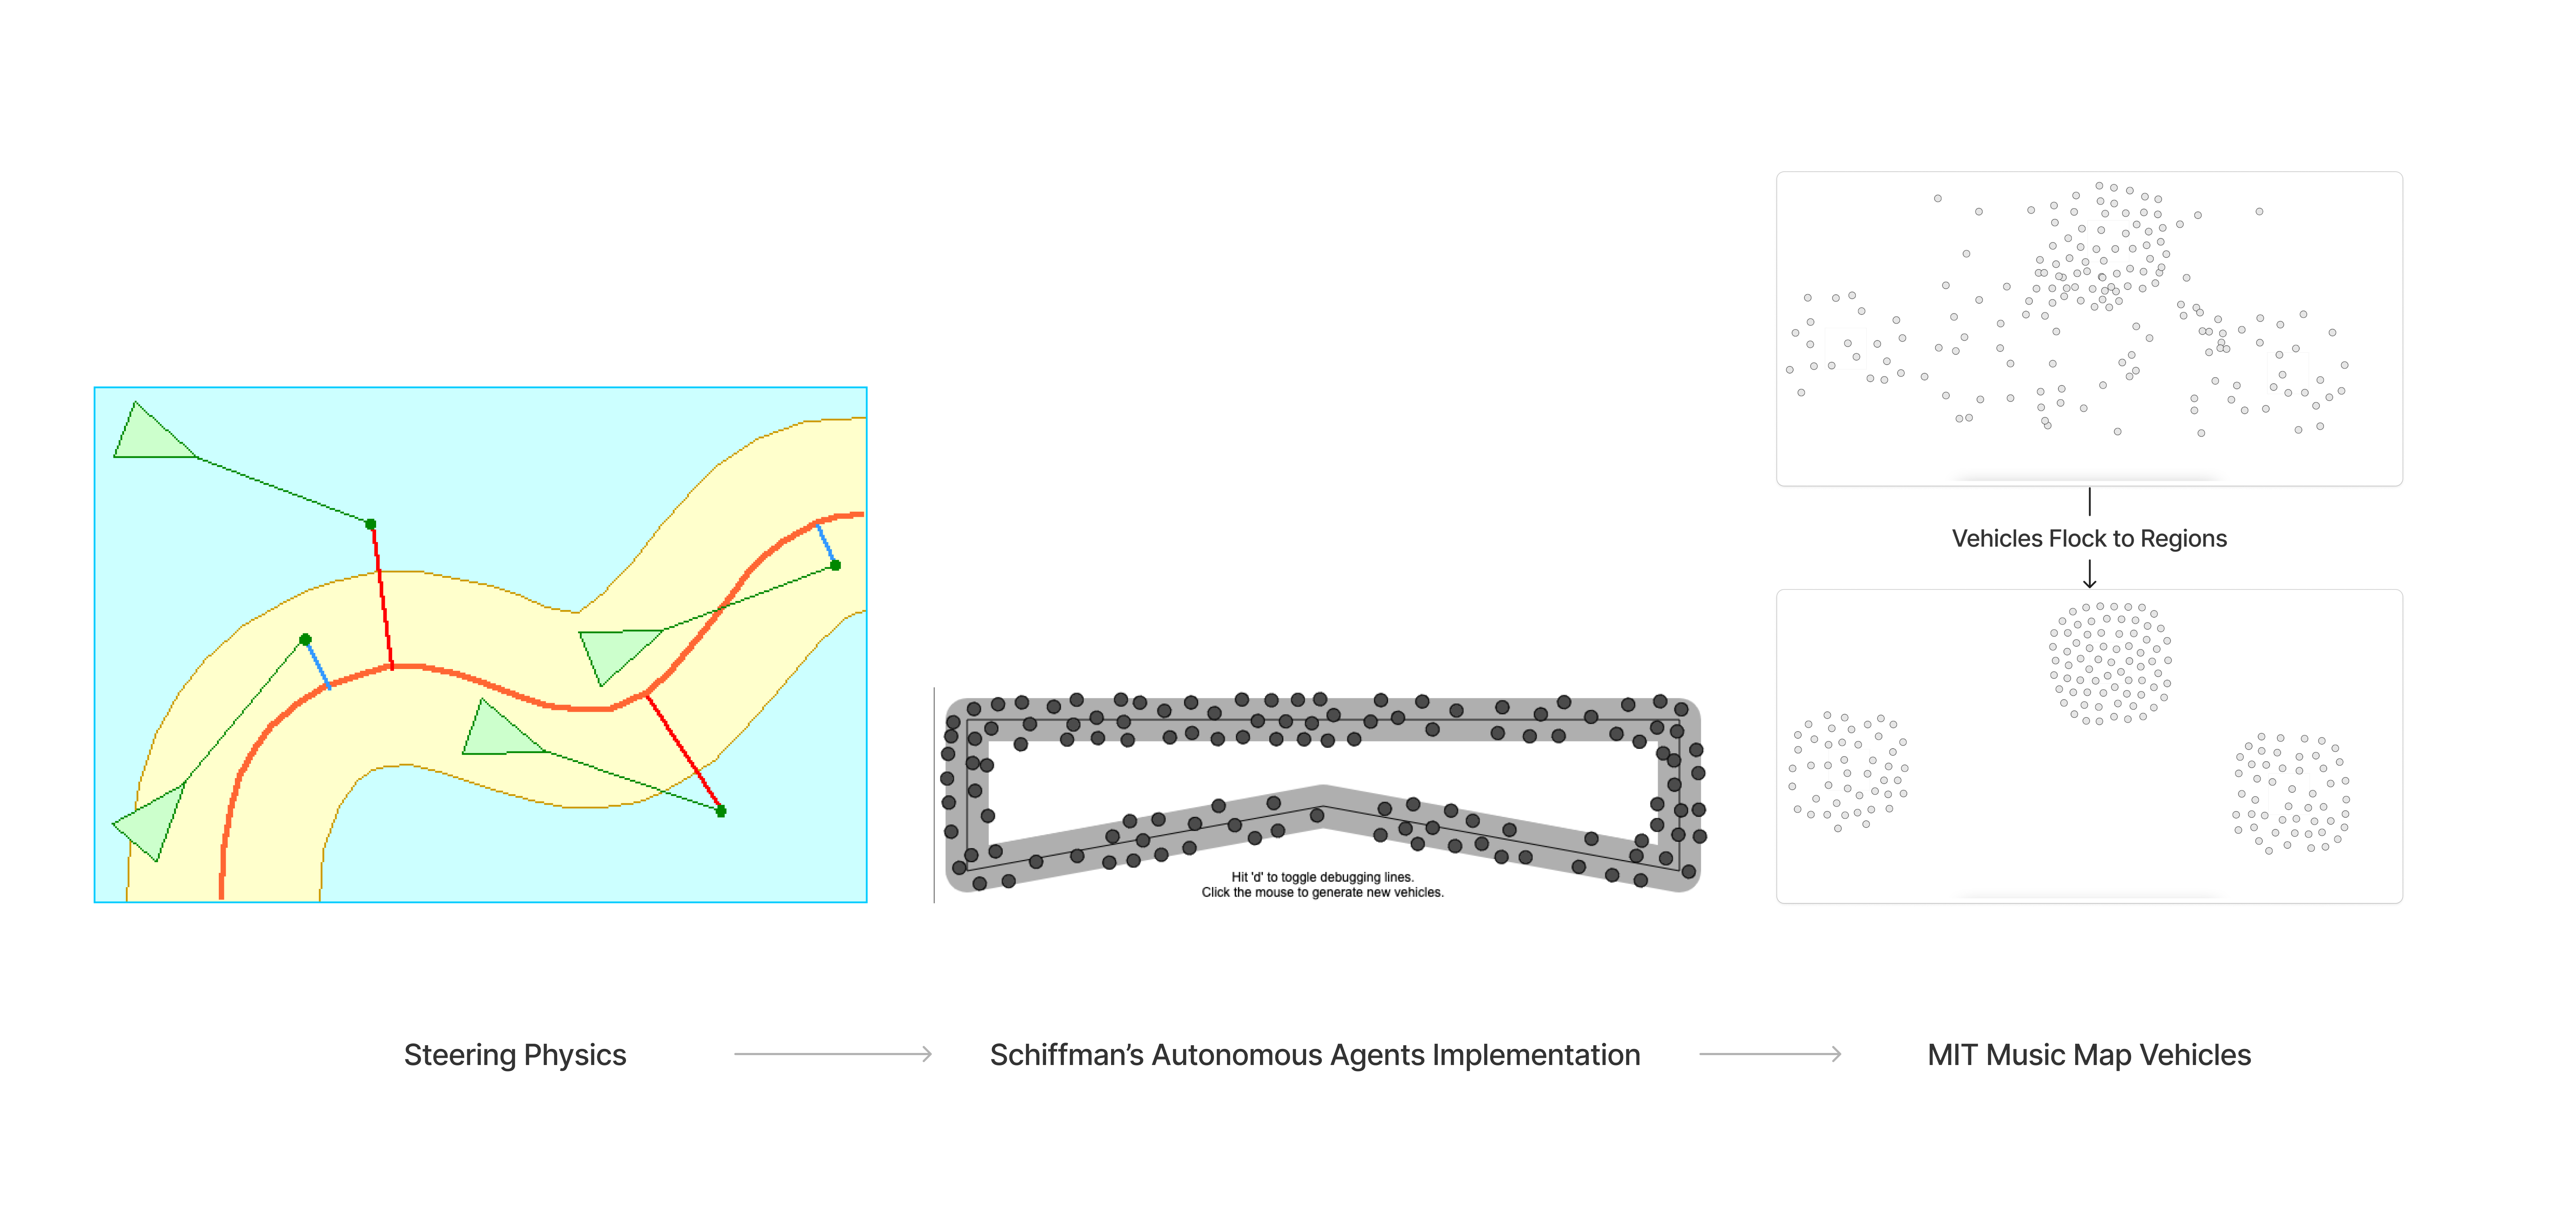
To make the flocking algorithm, I adapted code from Dan Shiffman's Autonomous Agents Chapter from The Nature of Code.
Below is a diagram of the logic behind the autonomous vehicles in the MIT Music Map.
Hovering
When a user hovers their mouse over a song, the song is highlighted and the song's name + artist is displayed.
Clicking
When a user clicks on a song, a popup appears with more information about the song.

Tech Stack
Frontend: Plain HTML
Graphics: p5.js
Hosting: Github